Data Views
A guide to the Data Views page in R2S

The Data Views page has been designed to give you more control and flexibility when working with your project's tags and tasks. You can access it through the Project Navbar.
Here you have a detailed overview of all the tags and tasks, including their underlying metadata. It's fully configurable too, allowing you to tailor the display to show exactly the information you need. You can even export the tags in Excel format for sharing or further analysis.
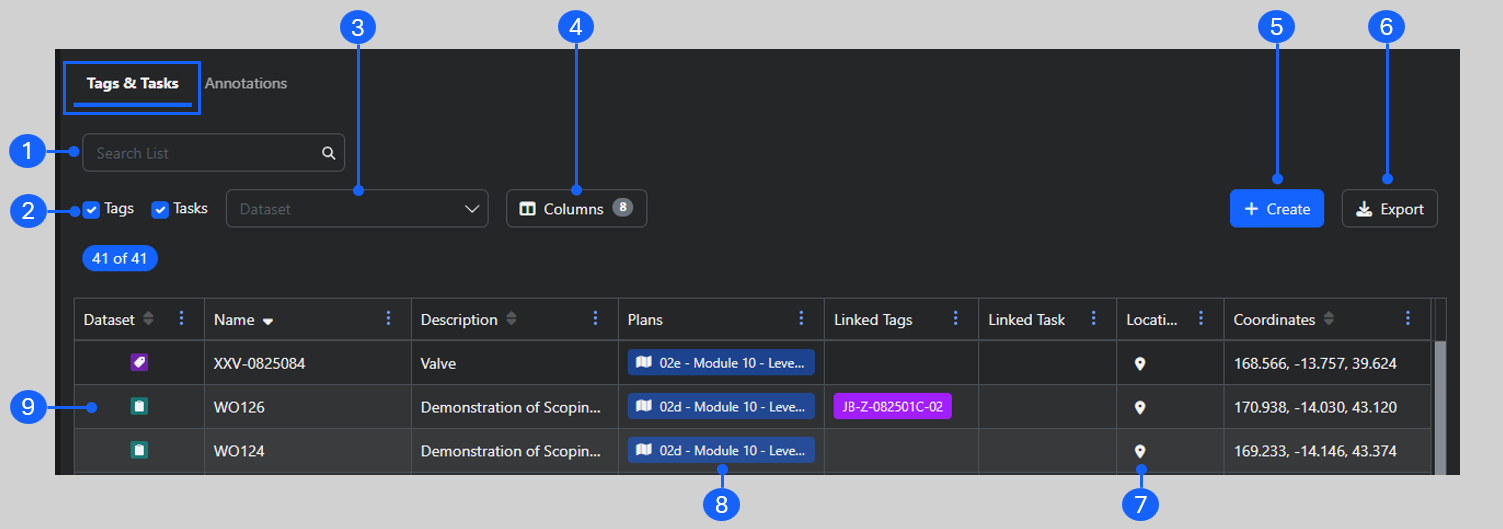
- Search List - start typing here to quickly find the tag or task you are looking for.
- Tags/Task Checkbox - quickly filter the list to see only tags or tasks
- Dataset Filter - choose only the datasets you need to see from a dropdown list
- Columns - opens an additional panel that lets add additional metadata fields to the view
- Create - make a new tag
- Export - download an Excel file containing everything in your filtered list
- Location Markers - open the nearest 360 image to the tag or task
- Plans - show the tag or task on the plan
- Open Tag Panel - click the tag icon to open to tag panel for further detail
Managing your View
You can customise your view by
- Toggling Tags or Tasks on or off
- Filtering for specific Datasets
- Rearranging the order columns are shown
- Sorting by Ascending/descending
- Picking which columns you want to see
When you export the Data View as an excel file, the view you create is retained.
Please Note: Currently, customised views cannot be saved (we're working on it!).
Have a look through this interactive guide to see how it works.
Creating Tags
If you have the Contributor role, you can add new tags, update their metadata, and add links and attachments without being in the Visual Model.
Follow these simple steps to add a new tag
- Click "Create" to open the Create New Item panel
- Select the Dataset you want to add the tag to
- Give it a name and description
- If you know where you want to place the tag, add in the coordinates (you can do this later)
- Click 'Save'
Once you've saved the tag, the Tag Panel opens, allowing you to add metadata, links and attachments.
Note: If you are having trouble using any tool or feature in R2S please contact our support team here.